Activity 3.9 Statistics and Quality
Introduction
Today’s consumers are constantly trying to judge the quality of products. But what is quality? How and by whom is quality determined? Some would say the designer creates specifications, which in turn dictate the quality of a product. That quality is also based on the acceptable value of a part within a whole product. Statistics are commonly used in manufacturing processes to control and maintain quality. This activity will allow you to apply statistics in order to analyze and determine the quality (as measured by the consistency of the size) of wooden cubes. The wooden cubes will be used in the Puzzle Cube Challenge in the next Unit. You will design and construct a puzzle cube as part of the challenge. The consistency in size of the wooden cubes will affect the quality of your final product.
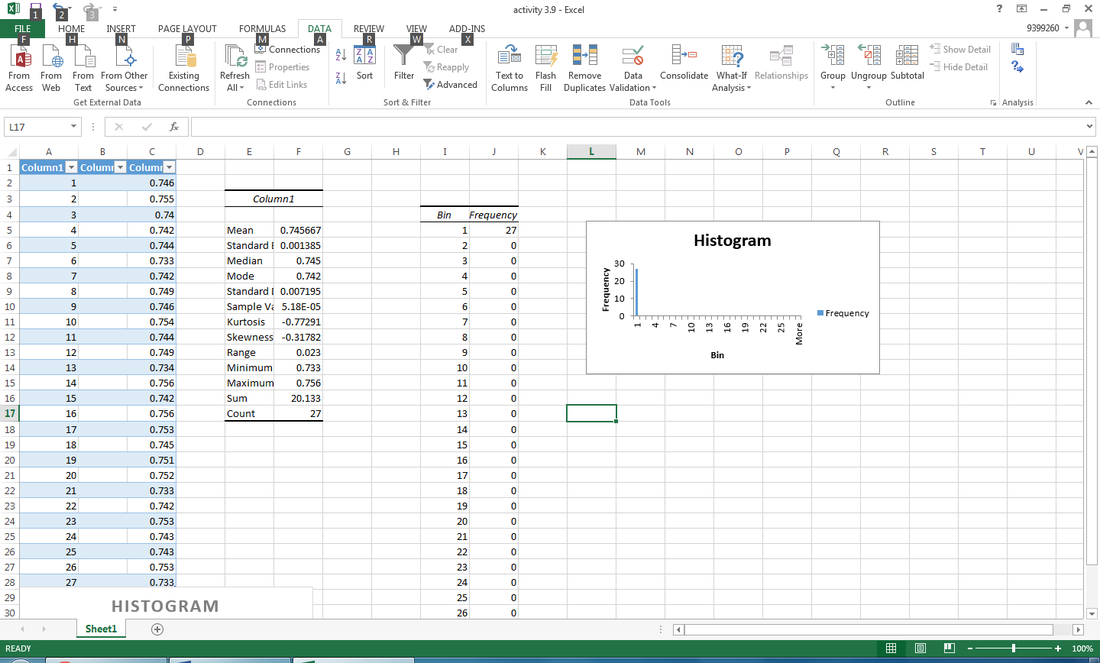
In this activity you will collect data and then perform a statistical analysis to estimate measures of central tendency and variation of a product (wooden cubes). You will represent the data using a histogram, establish criteria for an acceptable size of the product, and use the Empirical Rule to eliminate product samples that are outside an acceptable range.
Today’s consumers are constantly trying to judge the quality of products. But what is quality? How and by whom is quality determined? Some would say the designer creates specifications, which in turn dictate the quality of a product. That quality is also based on the acceptable value of a part within a whole product. Statistics are commonly used in manufacturing processes to control and maintain quality. This activity will allow you to apply statistics in order to analyze and determine the quality (as measured by the consistency of the size) of wooden cubes. The wooden cubes will be used in the Puzzle Cube Challenge in the next Unit. You will design and construct a puzzle cube as part of the challenge. The consistency in size of the wooden cubes will affect the quality of your final product.
In this activity you will collect data and then perform a statistical analysis to estimate measures of central tendency and variation of a product (wooden cubes). You will represent the data using a histogram, establish criteria for an acceptable size of the product, and use the Empirical Rule to eliminate product samples that are outside an acceptable range.
Conclusion
1. You have calculated statistics related to your 27 wooden cubes. Consider how your statistical analysis results would change if all of the data values for all of the cubes measured by all of the students in your class were compiled and used for analysis. Then answer the following questions.
a. How would the histogram of the entire class’ data change compared to your histogram?
If there blocks are different sizes
b. What value would you expect for the mean of the length measurements if the data from the entire class were used? Explain.
The mean would be larger that is because it depends on the how many blocks
c. Would you expect the standard deviation of the class’ measurements be larger, smaller, or about the same as the standard deviation of your measurements? Why?
larger be cause it would be more data
2. In which phase(s) of a design process might statistics be most useful? Why?
during the construction process and evaluating be cause they need that info to determine if it is good
3. How can statistics of a product’s dimensions be used to assess the quality of the product?
It can be used for clarification of how accurate they built or made the design
