Activity 3.7 Statistical Analysis with Excel
Introduction
Engineers use various tools to make their jobs easier. Spreadsheets can greatly improve the accuracy and efficiency of repetitive and common calculations; therefore, engineers often employ spreadsheet applications in their work.
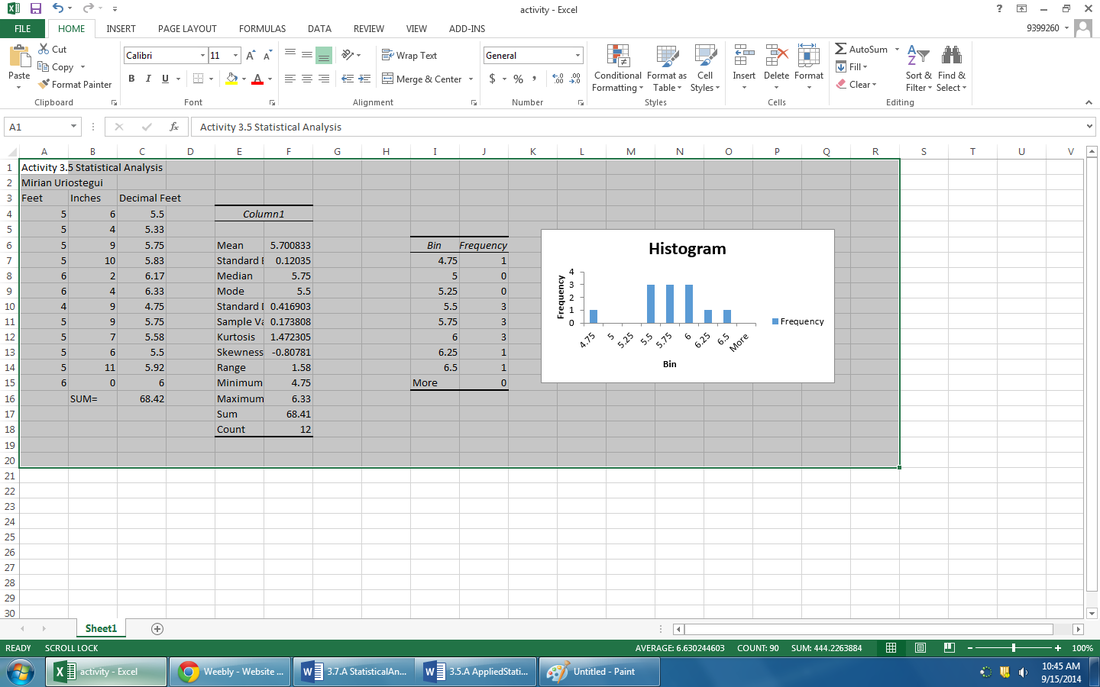
In this activity you will collect data and use Microsoft Excel to perform statistical analyses and create a statistical chart to display your data.
Engineers use various tools to make their jobs easier. Spreadsheets can greatly improve the accuracy and efficiency of repetitive and common calculations; therefore, engineers often employ spreadsheet applications in their work.
In this activity you will collect data and use Microsoft Excel to perform statistical analyses and create a statistical chart to display your data.
Conclusion
1. Describe the difference between population standard deviation and sample standard deviation. Describe a scenario in which you would use each.
standard deviation is just calculated by the mean and population deviation is calculated by its population
2. Which type of standard deviation (population or sample) is displayed when the Data Analysis Tool is used within Excel?
Sample is displayed
3. How do the statistics that you calculated using Excel compare to the statistics that you calculated by hand for the connector depth data?
the statistics calculated by excel is more accurate that the one calculated by hand
4. Other than the calculation of statistics, how could an engineer use a spreadsheet application to increase efficiency?
They can use a dial caliper or another type of measuring tool
